Many of you already know about my passion for bridging the so-called digital divide that separates communities of people from access. The areas that I am personally most interested in are low income and rural areas of the United States, which are often the most under-served communities in term of broadband access. A lot of you have heard the stories about how my parents only had access to dial-up until the past few years, but you might be surprised to learn that they still don’t have access to true broadband services. In January 15, the FCC increased the benchmark for what could truly be considered broadband service from 4Mbps/1Mbps (i.e., 4 download/1 upload) to a speed of 25Mbps/3Mbps. “The 4 Mbps/1 Mbps standard set in 2010 is dated and inadequate for evaluating whether advanced broadband is being deployed to all Americans in a timely way, the FCC found.”
The 4 Mbps/1 Mbps standard set in 2010 is dated and inadequate for evaluating whether advanced broadband is being deployed to all Americans in a timely way, the FCC found.
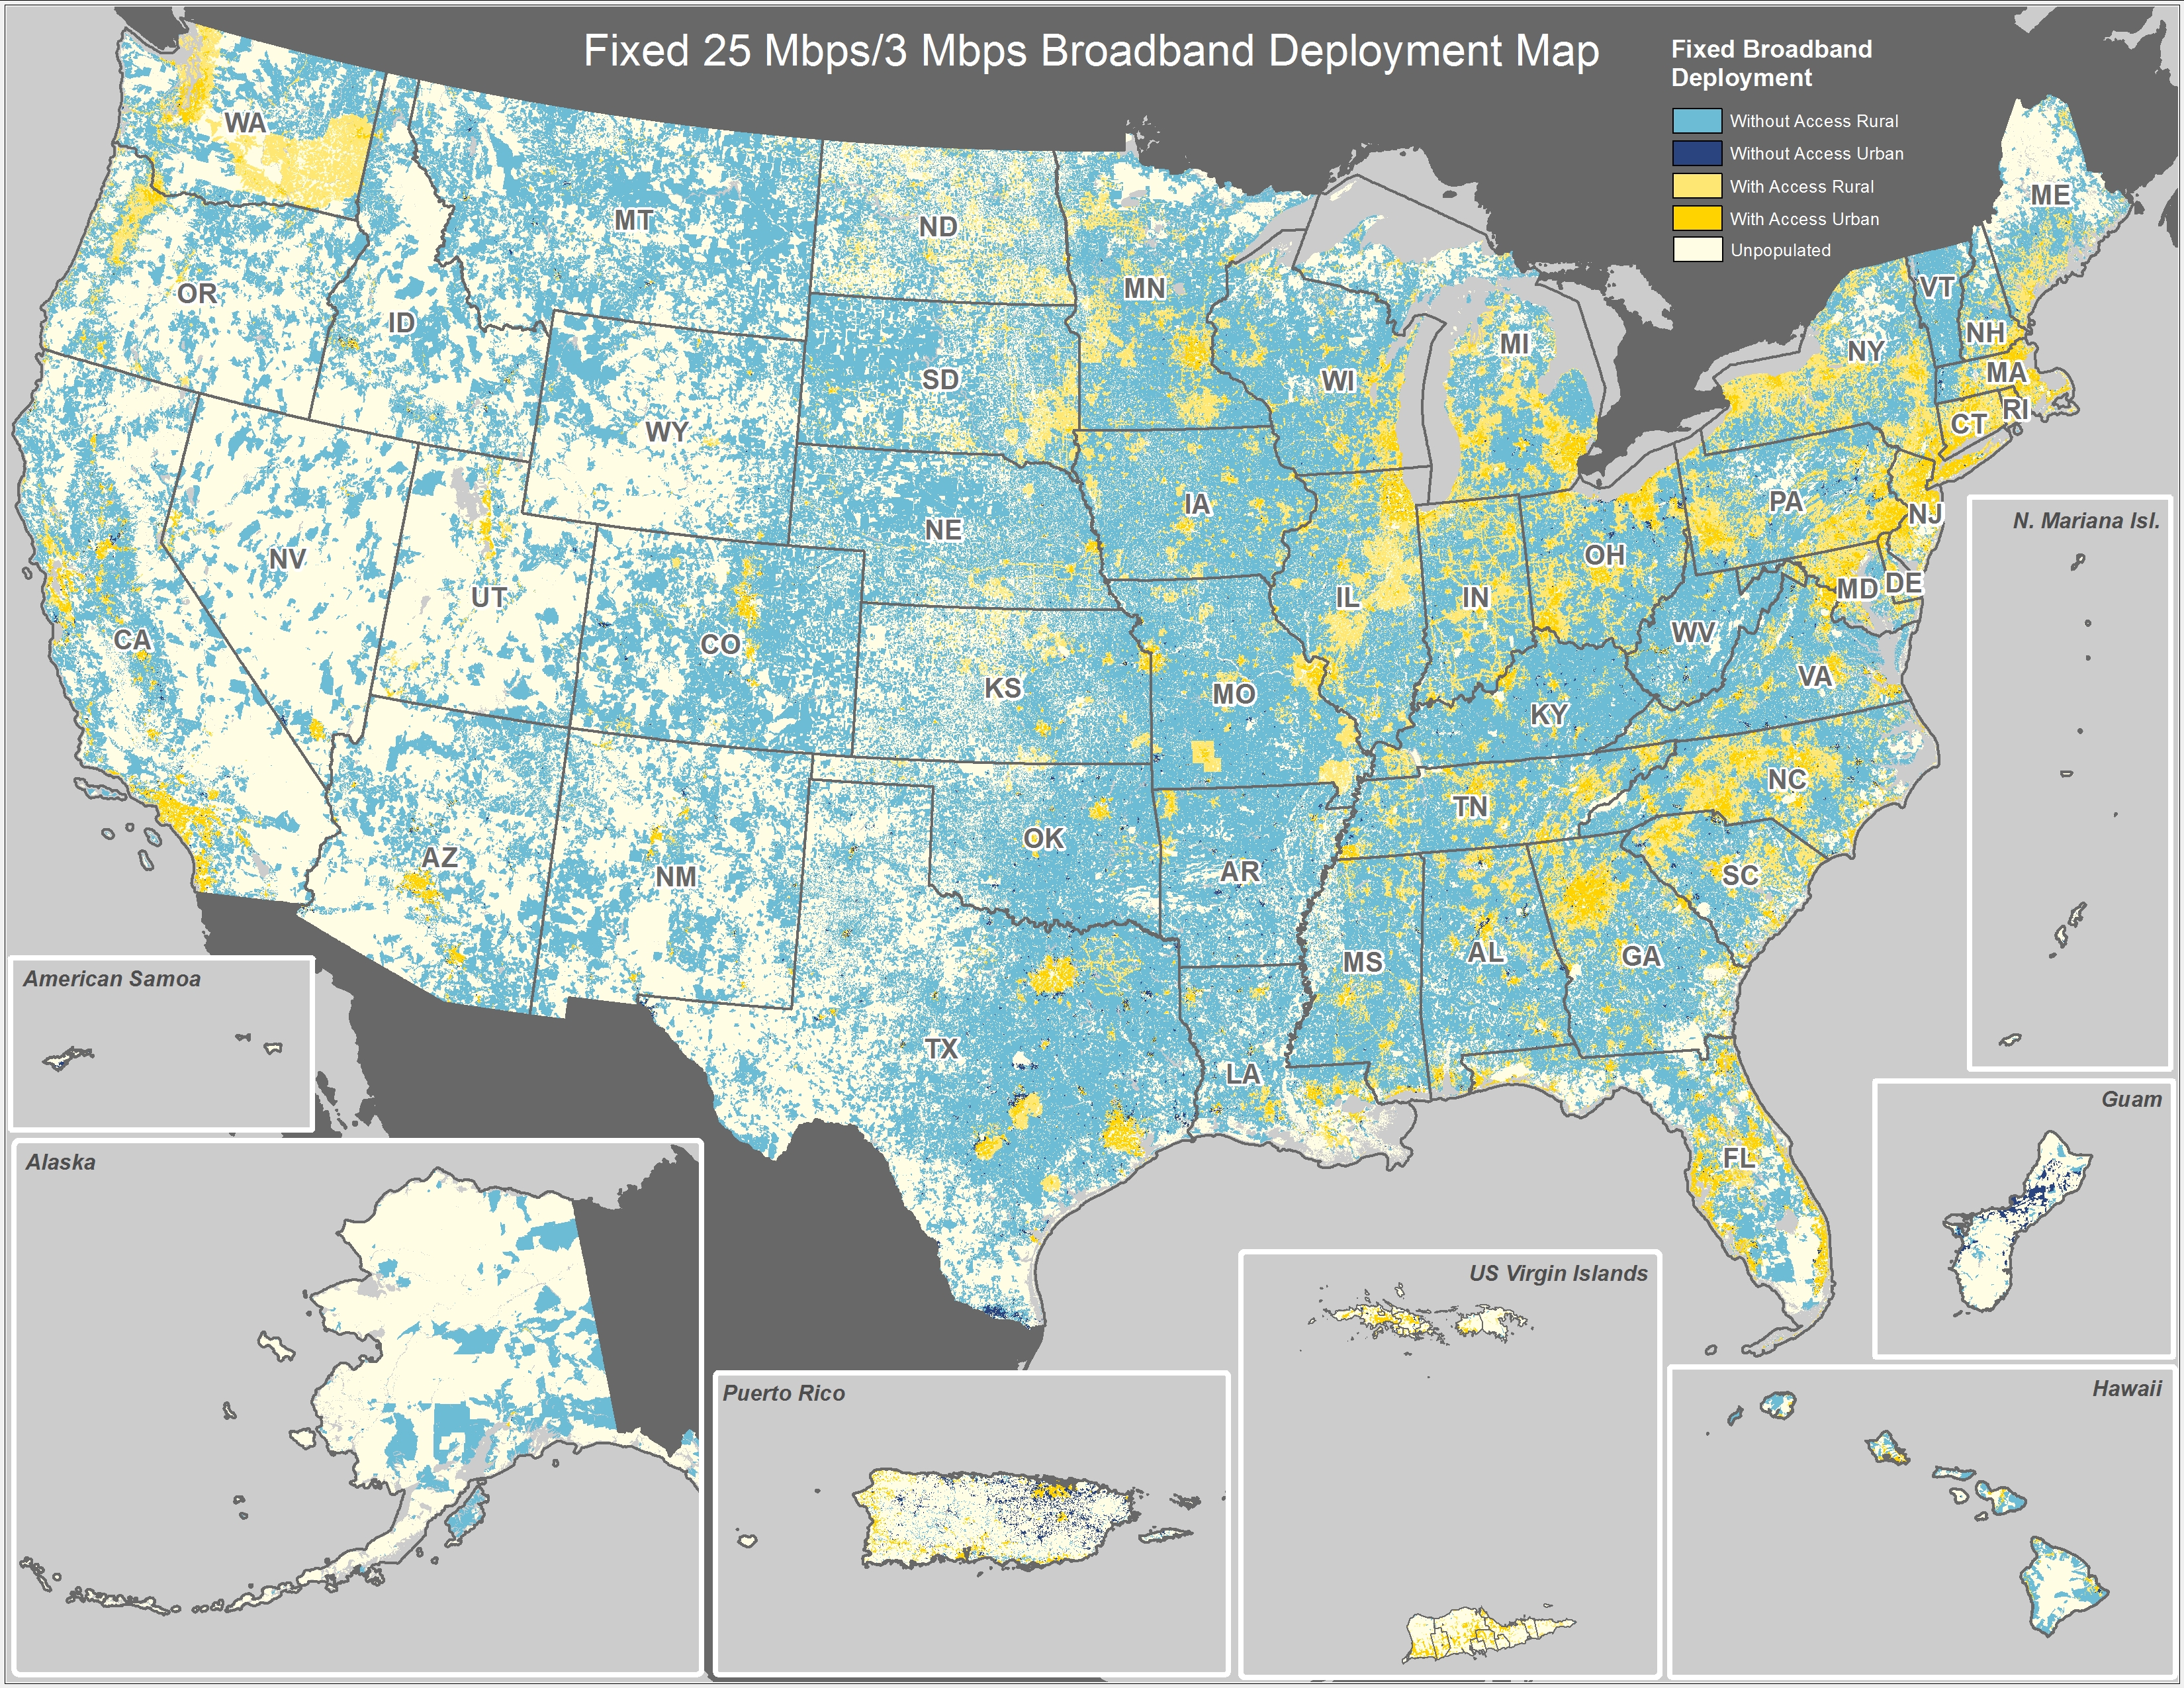
Using this updated service benchmark, the 2015 report finds that 55 million Americans – 17 percent of the population – lack access to advanced broadband. Moreover, a significant digital divide remains between urban and rural America: Over half of all rural Americans lack access to 25 Mbps/3 Mbps service.
The divide is still greater on Tribal lands and in U.S. territories, where nearly 2/3 of residents lack access to today’s speeds. And 35 percent of schools across the nation still lack access to fiber networks capable of delivering the advanced broadband required to support today’s digital-learning tools. (source; also attached at bottom of this post)
That’s a huge difference for rural folks, those living in territories or Tribal lands, and schools, people. Yet broadband providers are arguing that the old rules were fast enough, even as internet access needs get faster and faster. (Have you tried to access anything on the internet from dial-up lately? Believe me, it’s worse than you remember it being in the late 90s…)

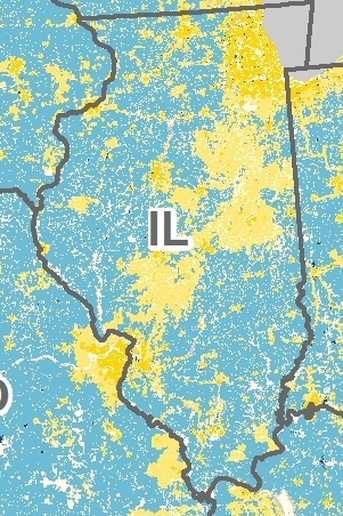
Pick an area you know well and zoom in on that map above. (If you click it, it will go directly to the FCC’s original image, where you can zoom in more.) I chose Illinois, of course.
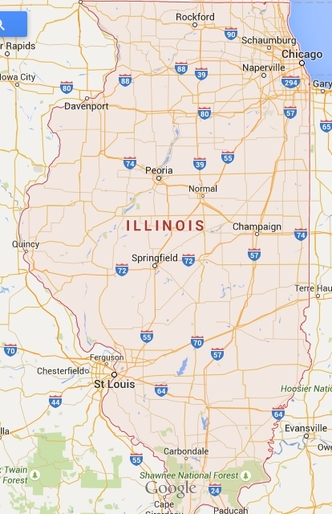
When you know an area well, you can usually determine why the broadband follows the routes it takes. I can see Quincy, Illinois, on there. (That orange-ish belly button.) Here, I’ll help you a little bit:


Clearly the areas with access are the more settled areas: Chicago, greater St. Louis, I-55 (travels from Chicago to St. Louis), Springfield (capital city), Champaign-Urbana metro area (home of the University of Illinois), and so on. While this made more sense 10 years ago, we’re long past the time that broadband services have gone from being a nice way to browse the internet without lag to being an educational necessity.
Today’s news that the FCC’s Connect America Fund will be partnering with broadband providers to expand service is welcome, but it’s not enough. Seven million people in 45 states and 1 territory hardly makes a dent in the 55 million across the United States without access.
Did you know?
- The FCC provides a yearly broadband report on their findings based on speed tests and other information. Here’s the 2015 Broadband Progress Report site, where you can also find a link to past reports. (I download these every year to keep track of where we are.)
- If you want to see the state of broadband service in your area, check out the National Broadband Map. Don’t see your provider? Let the FCC know, and they will take it into account for the next cycle.
- If you’re interested in helping the government learn about speeds offered by different providers and how that stacks up against actual speeds consumers receive, you might want to sign up to participate in SamKnows.
- The FCC measures both fixed and mobile broadband. Want to know more about their methodology? Check it out here.
Document attachment: doc-331760a1_broadband_speed_reclassification


